Investigating bike rentals in Cologne - Part 2: Map visualization
In the first part of this post, we found the source of the location data on the KVB-Bikes site and wrote a Python script to retrieve it. In this part, we will use the collected data to investigate basic patterns of bike usage in Cologne. As a first step, we will use maps to visualize some features of the data.
UPDATE: You can find data similar to the one used in this article here. Because it is slightly different you will have do adapt the read_data function below.
Setting up required packages
For this task we will need a bunch of Python libraries. A good way to get started is to install the extensive Anaconda distribution. I use the Python 3.6 version. It comes with numerous packages that are useful for data analysis and scientific tasks. There are only a few additional packages to install:
conda install basemap
conda install -c https://conda.anaconda.org/OGGM descartes
pip install fiona
I had to use pip for installing fiona, because conda failed to do so. Make sure to use the pip coming with your anaconda installation. You should be able to set up your Python script and import the following libraries now:
import fiona
from mpl_toolkits.basemap import Basemap
import pandas as pd
from shapely.geometry import Polygon, Point, MultiPoint, MultiPolygon
from shapely.prepared import prep
import matplotlib.pyplot as plt
from matplotlib.collections import PatchCollection
from matplotlib.colors import Normalize
from descartes import PolygonPatch
Fiona enables us to open a shapefile and extract data from it. Basemap is an extension of matplotlib for easy plotting of maps. Shapely, surprise, deals with shapes.
A great and extensive introduction to Basemap for Python can be found here. Here is another nice and more practical article. It uses British housing prices to demonstrate plotting maps and using shapefiles.
Getting a map of Cologne
As a starting point, it would be nice to have a map depicting the neighborhoods or “Veedel” as they are called in Cologne. Shapefile is a widespread format for representing such geospatial data. By combining points, lines and polygons they can represent any shape needed to create a map. Turns out, there is a neat open data initiative for Cologne. Among others, it provides a map of Cologne’s districts in shape format consisting of the following files:
|-- Stadtteil.dbf
|-- Stadtteil.prj
|-- Stadtteil.sbn
|-- Stadtteil.sbx
|-- Stadtteil.shp
|-- Stadtteil.shx
The way locations are represented in shapefiles varies substantially. This is because there are numerous ways to depict location data, called coordinate reference systems (CRS). The World Geodetic System (WGS) is the most common one. The latest revision, WGS 84, is what basemap expects. Unfortunately, the provided file for Cologne uses a different CRS. The website states that the shapefile is in “ETRS 1989 / UTM Zone 32N” format. We could also have learned this by looking at the .prj file, which contains information on the CRS used. This mismatch in formats leads to the following error when trying to open the shapefile:
ValueError: lat_0 must be between -90.000000 and 90.000000 degrees
Above that, the files also use an encoding different from UTF-8. While Python 2 had no problem with that, Python 3 couldn’t read the files:
UnicodeDecodeError: 'utf-8' codec can't decode byte 0xfc in position 6: invalid start byte
Consequently, before using the shapefile we need to process it.
Pre-processing the shapefile
Our goal is to convert the location data in our shapefile to WGS84 format which uses latitudes and longitudes. Moreover, we want to change the encoding to UTF-8. There are two methods to get this done:
- Install the open-source software QGIS. It is available for Windows and Linux. QGIS is a convenient, graphical way to work on geospatial data and is able to open, manipulate and convert shapefiles.
- The open-source library GDAL provides a set of useful command-line tools for working on geospatial data. In our case we convert to EPSG 4326 and set the encoding to UTF-8. The EPSG code is just a convention to define a CRS and its additional properties.
$ ogr2ogr -lco ENCODING=UTF-8 -t_srs EPSG:4326 Stadtteil_WGS84.shp Stadtteil.shp
The converted shapefile Stadtteil_WGS84.shp is now ready to be used with basemap.
Plotting the map
We can now use our pre-processed files to draw a map. From the main part of the script, we call a create_map function:
def main():
    create_map()

if __name__ == '__main__':
    main()
In the function we open the shapefile through fiona. Then, we extracts the coordinates of the map boundaries. Next, we set up a pyplot object and create a basemap instance. The projection parameter defines how the surface of our 3D earth is projected onto the 2D map. Finally, we read the shapefile into our basemap and plot it:
def create_map():
    shp = fiona.open("./maps/Stadtteil_WGS84.shp") # Cologne districts shapefile
    coords = shp.bounds         # Extract the bound coordinates from the shapefile
    shp.close()

    fig, ax = plt.subplots(figsize=(8,8))  # figure and axis objects
    m = Basemap(
        projection='tmerc', ellps='WGS84', # set transverse mercator proj. and ellipsoid
        lon_0=(coords[0] + coords[2]) / 2, # longitude center
        lat_0=(coords[1] + coords[3]) / 2, # latitude center
        llcrnrlon=coords[0],    # left lower corner
        llcrnrlat=coords[1],
        urcrnrlon=coords[2],    # upper right corner
        urcrnrlat=coords[3] ,
        resolution='c',  suppress_ticks=True
        )

    m.readshapefile("./maps/Stadtteil_WGS84", name='cologne', drawbounds=True, color='blue')
    plt.show()
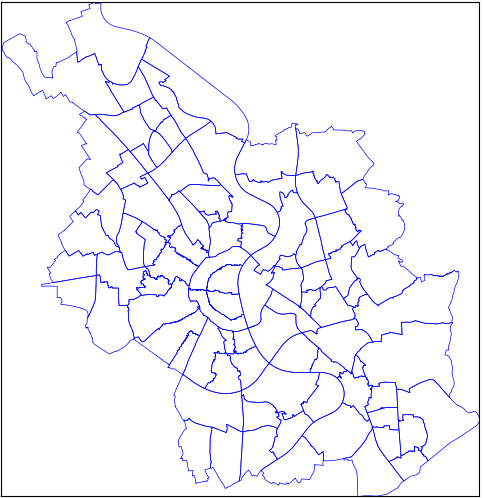
Here is the result:

Visualizing bikes per neighborhood - Choropleth map
Now that we have learned how to plot a basic map, we will use it to display information from our KVB-bikes dataset. An interesting visualization is the distribution of bikes in the neighborhoods. An appropriate way to depict this is a choropleth map. That is a map that shades areas according to some measure. Surely, you have seen it in the context of elections. Our measure will be the number of bikes per area. Let’s get started by reading in some of the data we’ve collected in the first part:
def read_data(filename):
    colnames =["scrape_date","scrape_time","scrape_weekday","u_id","bike_id","lat","lon","bike_name"]
    with open(filename,"r") as f:
        data = pd.read_csv(filename, names=colnames, nrows=1000)

    data = data[data.bike_name.str.contains("BIKE")].reset_index()  # Drop all stations
    # Convert str dates to datetime object
    data.scrape_date = pd.to_datetime(data.scrape_date)
    data.scrape_time = pd.to_datetime(data.scrape_time, format="%H-%M-%S")
    return data
We use the pandas read_csv function to open our file. Because we have not included the column names in our data before, we specify them here and add them as a parameter. For testing purposes we limit the number of data points we read in to 1000. Next, we remove all entries that represent stations instead of free-floating bikes. Finally, the columns containing the date and time the data was retrieved on are converted to pandas datetime format. Then, wee add the following code to the create_map() function:
data = read_data("/kvb/data/combined.csv")

df_map = pd.DataFrame( {
    "poly": [Polygon(xy) for xy in m.cologne],
    "Veedel": [x["STT_NAME"] for x in m.cologne_info ]
    })
df_map["area_km"] = df_map["poly"].map(lambda x: x.area / 1000)

map_points = [Point(m(x,y)) for x,y
                in zip(data.lon, data.lat)] # Convert Data Points to projection, then to Shapely
all_points = MultiPoint(map_points)
veedel_poly = prep(MultiPolygon(list(df_map.poly.values )))
all_points = list(filter(veedel_poly.contains, all_points)) # Select only points within map boundaries

df_map["bikes_count"] = df_map.poly.apply(points_per_poly, args=(all_points,) )
df_map["bikes_per_area"] = df_map.bikes_count / df_map.area_km
This reads in the data and creates a new pandas DataFrame. It contains the polygons we extract from the cologne shapefile and convert to shapely polygons. Each polygon represents a neighborhood. Thus, we also add its name to the DataFrame. We can do this because shapefiles come with additional feature attributes. These are stored in the .dbf file. For each shape there is a corresponding attribute. In this case, each polygon aka. district comes with the corresponding name. Lastly, we calculate the area of each polygon and store it in the column “area_km”.
Following, we compare whether the coordinates of a bike lie within the boundaries of a district. Or in technical terms, does a polygon contain the point representing the bike’s location? At the moment, the bike coordinates consist of a latitude and longitude. In order to compare them to locations on the map, we need to convert them to the same projection first. We do this by calling our Basemap object m with the coordinates as parameters. We get our inputs as coordinates projected on the map in return, convert them to shapely Points and store them to the map_points list. Now, we have the districts as polygons and the bike locations as points. Using shapely’s contains method we filter out all points outside of the neighborhoods. In the last two lines we create the bikes count and bikes per area measure. To create the former, the function points_per_poly is applied to the poly column of df_map. We pass over all points within our map as a parameter. The function is defined as follows:
def points_per_poly(poly, points):
    poly = prep(poly)
    return int(len(list(filter(poly.contains, points))))
For each polygon, it simply returns the number of points contained, i.e. the number of bikes in that neighborhood. Before using the polygon, we convert it to a prepared geometry. This speeds up the the comparison significantly: Checking 20.000 points takes 20% less time with my setup.
Next, we use our measure to color each district according to its value. Depending on the value of bikes_per_area we assign a color from the Reds scale to each polygon. Additionally, we display a colorbar showing how the color and our measure are linked. Finally, we draw the plot:
df_map.patch = df_map.poly.map(lambda x: PolygonPatch(x))
pc = PatchCollection(df_map.patch, match_original=False, zorder=2)

pc.set(array=df_map.bikes_per_area.values, cmap='Reds') # impose color map onto patch collection
fig.colorbar(pc, label="Bike density")  # Draw Colorbar and display the measure
ax.add_collection(pc)                   # add patchcollection to axis

plt.show()
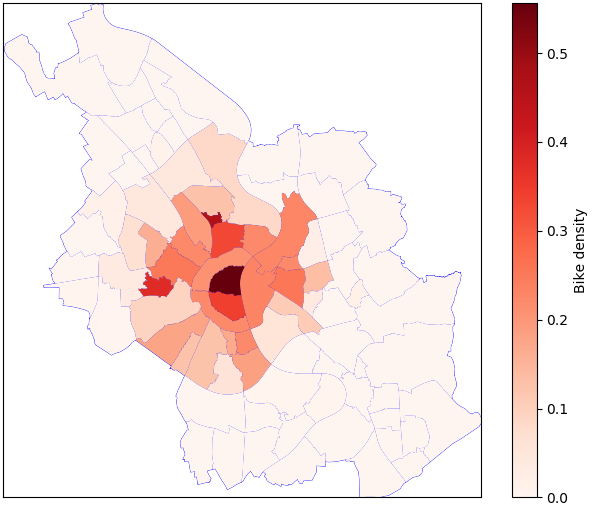
And this is the resulting choropleth map:

The first thing we see is that a lot of districts don’t have any bikes. This is because the service is limited to a “core” part of the city. You are not supposed to leave bikes outside of this predefined boundary. Moreover, the central parts of Cologne have a very high bike density. The district “Altstadt-Nord” shows by far the highest concentration. But what about the small neighborhood in the north? Which part of the city is that? To find out, let’s plot the names of the districts with the highest bike density on the map. Add the following to create_map():
centroids = df_map["poly"].map(lambda x: x.centroid) # get center of each polygon
for i, (point, label) in enumerate(zip(centroids, df_map.district)):
    if df_map.loc[i, "bikes_per_area"] > df_map.bikes_per_area.quantile(0.95):
        ax.text(point.x, point.y, label, ha='center', size=8) # plot text in center
First, we get the center coordinates for each polygon. Next, we loop through all districts. Thereby, we check whether the bike density in a specific neighborhood is higher than the 95th percentile. If it is, we plot the name of the district in its center. Lastly, there is one more thing to do. The value of bikes_per_area is only accurate, if we only look at one point in time. Otherwise, it is the sum of bikes over the period that we look at. Thus, it has a relative meaning, but the absolute value is misleading. To avoid misinterpretation, we add the following after the line that computes the measure:
norm = Normalize(df_map.bikes_per_area.min(),df_map.bikes_per_area.max())
df_map.bikes_per_area = norm(df_map.bikes_per_area.values)
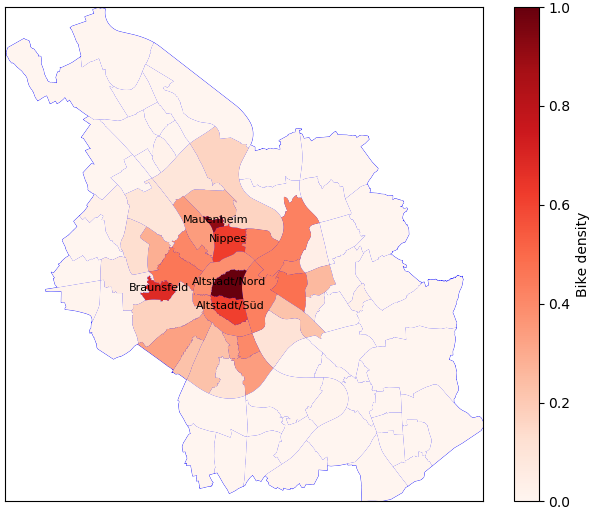
With this code, we normalize the measure using the Normalize() class from matplotlib.colors. Consequently, the lowest value in our sample will become a zero and the highest will become a one. Now, we can look at the result and make comparisons between the districts:

I’d say, that’s a pretty complete and neat visualization by now. We see that besides the city center also Braunsfeld, Nippes and Mauenheim have a high density of bikes. For Braunsfeld, I’d guess that this is because of the sports university nearby. Many students use the rental bikes. Also, the KVB central is situated in this neighborhood. Probably, they encourage their employees to use rental bikes and also make sure to keep a fair amount of bikes on location. Building on this choropleth map, there are some more patterns to investigate:
- How does the distribution of bikes change during the day? I can imagine that in the morning and afternoon many bikes move into areas where people go to work, school or university. In the evening, they might move to areas for leisure or back into more residential areas.
- Are there differences between weekdays and weekends? Here again, I’d guess to see a pattern of work related use vs. leisure related use.
A cool way to visualize such patterns would be an animation of the changes in the bike density over time. I will look at this in an upcoming post.