Investigating bike rentals in Cologne - Part 1: Getting some data
In this multi part post, I will take a look at the bike rental system in Cologne. We’ll be dealing with web-scraping, GeoData and map-visualization in order to search for interesting patterns in bike-rental data. Let’s get started with gathering the data!
I like to ride my bicycle. I like to ride my bike…
Inner city traffic is a huge problem for most metropolitan areas. That is why many cities have implemented concepts for limiting car usage. Besides several car-sharing operators most cities have also started offering the (free) usage of rental bikes. Not only is that a blessing for the environment, but many times riding short distances by bike will be faster than by car or even public transport. For me, my bike is still by far the most used mode of transportation. I was happy when the first bike rental Call-a-Bike by Deutsche Bahn appeared in Cologne. Some time later, the local public transportation service (Koelner-Verkehrs-Betriebe) started offering the KVB-Rad. I liked this even better, since the service is free for students. The KVB-bike system does not use any stations, but is a “free-floating” implementation. I see KVB-bikes all over the city. Whenever I am in desperate need of one, however, I am out of luck. Why is that? To answer this, I decided to gather some data and look into it.
Where to look for data?
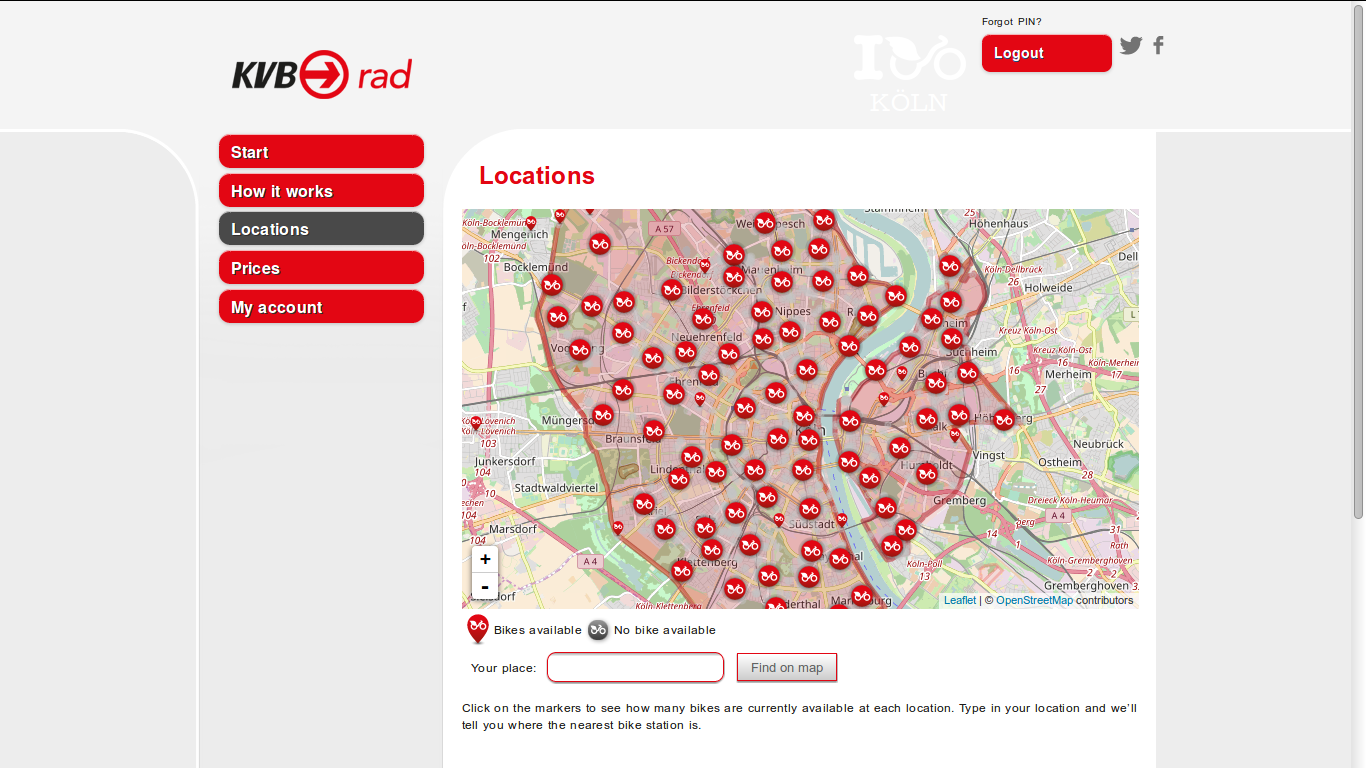
Lets take a first look at the website of KVB-Rad: Wow, what a fancy design! But lets not get too excited, there is some work to do. Snooping around, we realize that the bikes are actually provided by nextbike GmbH and KVB just re-brands them. This means, the people at KVB are probably not too involved with the technical issues. Actually, it would be interesting to know whether they have somebody looking at the data at all. But for now, let’s look at the bike locations page:

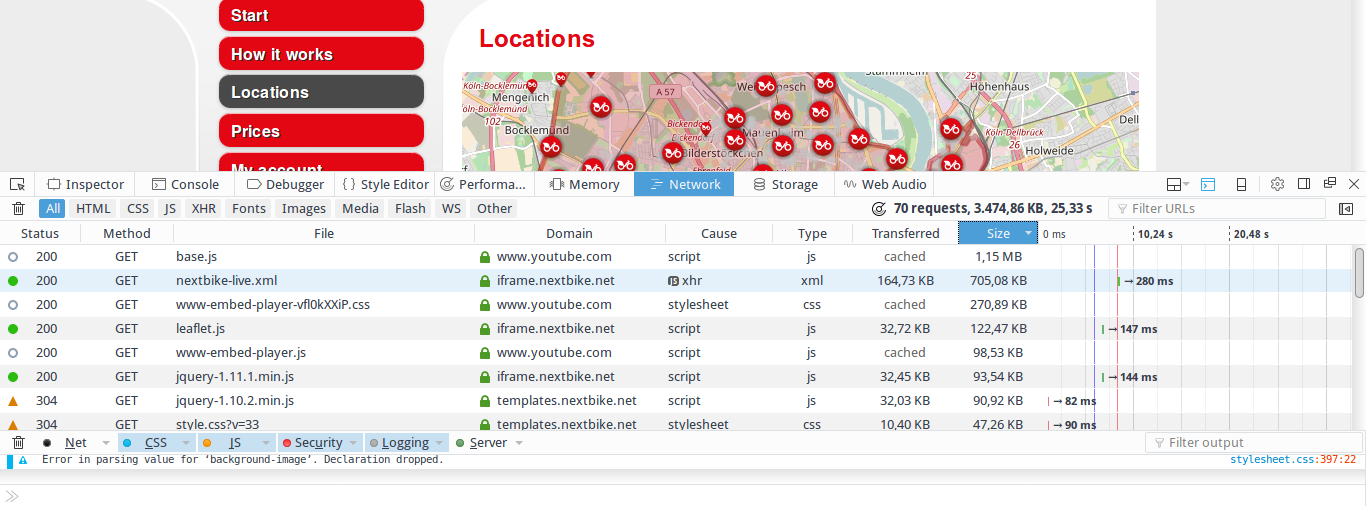
The map is based on OpenStreetMap data. The bike locations are display with the help of JavaScript via Leaftlet. Usually, in such cases the location data is requested via API from an endpoint. The response is then delivered via JSON (or a similar format) and Leaflet plots it on the map. If we can find out how the data is requested, we have a solid starting point. Turns out this is easy using the developer tools integrated in modern browsers. In Firefox and Chrome you can access them via right click –> Inspector. Switch to the Network-tab, clear the output and reload the website:

Look at the amount of data transmitted: about 3MB. Despite the site being really fancy, that’s a lot… Let’s arrange the list by size. We see a 1MB file base.js loaded from youtube.com and nextbike-live.xml with 700KB from iframe.nextbike.net. Turns out that the first file is for embedding youtube videos. There are some videos on the “how it works” page. That is where the file is actually needed. But why would you waste traffic and bloat your site by including this on every single page? … Not very efficient. There are better ways to do it.
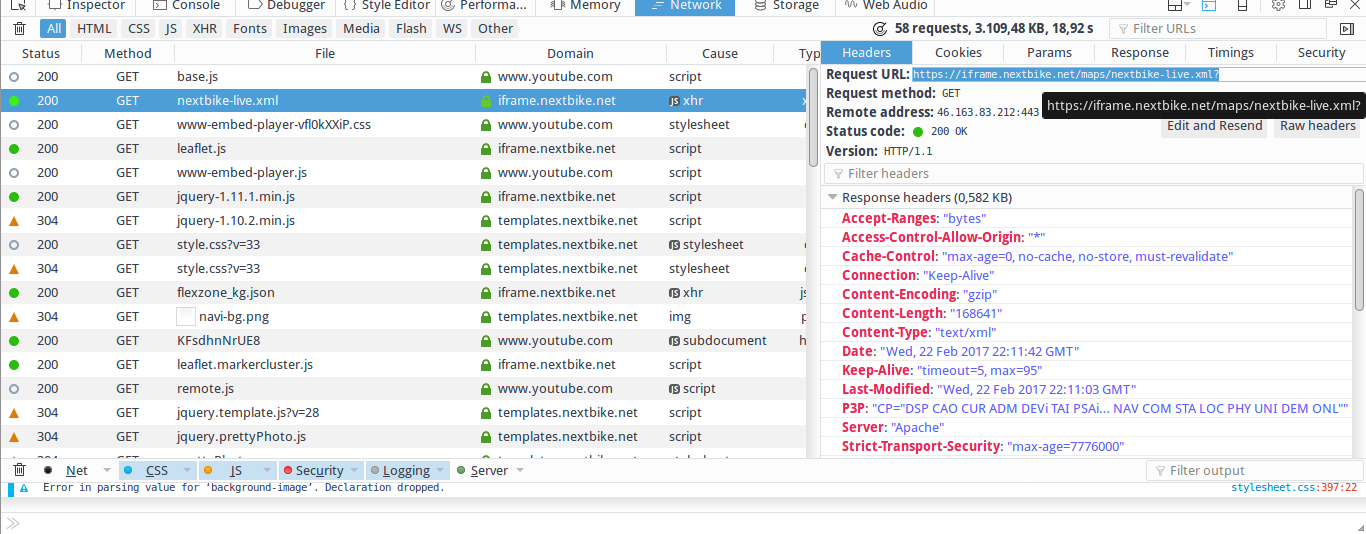
However, for us the second file in the list is really interesting, since we know that nextbike is the actual service provider. Lets click on it to get more details. The parameter tab is empty, but we find the url https://iframe.nextbike.net/maps/nextbike-live.xml?

This seems promising, so let’s take a closer look by requesting the url. Doing so, returns an XML file with a bunch of data. For a quick intro to XML check https://www.tutorialspoint.com/xml/xml_tree_structure.htm. Basically, XML is a descriptive, human and machine readable format. It is built following the Document Object Model (DOM) resulting in a tree like structure. Consequently, it starts with a root element which can be followed by multiple child elements. It is often used to exchange arbitrary data, i.e. in web applications. So, what kind of data does our file contain?
<markers>
<country lat="50.9364" lng="6.96053" zoom="11" name="KVB Rad Germany" hotline="+493069205046" domain="kg" country="DE" country_name="Germany" terms="https://www.kvb-rad.de/de/agb/" policy="" website="https://www.kvb-rad.de/">
<city uid="14" lat="50.9429" lng="6.95649" zoom="12" maps_icon="norisbike" alias="koeln" break="0" name="Köln" num_places="1184" refresh_rate="411" bounds="{"south_west":{"lat":50.8948,"lng":6.8448},"north_east":{"lat":50.9995,"lng":7.0329}}">
<place uid="35409" lat="50.9429485" lng="6.958015" name="Hauptbahnhof" spot="1" number="4826" bikes="0" terminal_type="free"/>
<place uid="430479" lat="50.938831373138" lng="6.9062697887421" name="KVB Hauptverwaltung" spot="1" number="4821" bikes="5" bike_numbers="21486,21458,21301,21523,21834" bike_types="{"15":5}"/>
<place uid="2683216" lat="50.92628173" lng="6.89499175" name="BIKE 22105" bikes="1" bike="1" bike_numbers="22105" bike_types="{"15":1}"/>
<place uid="2683217" lat="50.90771065" lng="6.942305433" name="BIKE 22360" bikes="1" bike="1" bike_numbers="22360" bike_types="{"15":1}"/>
</city>
</country>
</markers>
I’ve cleaned up the file a bit and removed all but four representative entries with a <place> tag. Now, we can easily observe its structure: The root element here is <markers> followed by <country>, <city> and many <place> elements. Each element contains information in form of its attributes. Each <place> element contains the location of a bike as a latitude and longitude. Moreover, bike_numbers and name include a unique bike id. The first few entries represent bike stations, i.e. the first one name="Hauptbahnhof" is one at the central train station. However, in Cologne there are no physical stations for bikes. These actually are spots where several bikes are placed together from time to time. My guess is that this happens when new bikes are added to the fleet or old ones are brought back into circulation after being repaired. That’s why we can ignore entries where “BIKE” is not included in the name attribute.
Now that we know what to look for, let’s go back to the unedited, original file. There seems to be a tremendous amount of data in it. Actually, a bit too much: there is data from Poland, Latvia, New Zealand and many more. Seems like the site is requesting data for all next-bikes instead of restricting itself to Cologne. Again, not very efficient, causing uncalled for traffic and slowing down the site. Turns out that changing the request to https://nextbike.net/maps/nextbike-live.xml?domains=kg would be the obvious solution. In the following, we will be using this url to gather data and build our little bike location database.
Retrieving the data
Now that we know where to find the data and how it is structured, we can start programming. Let’s write a python script that automatically retrieves the data, parses the XML, extracts the interesting parts and writes them to disk. We will need the following modules and constants:
import os
import sys
import requests
import gzip
import random
import csv
import time
from time import strftime
import smtplib
try:
	import cElementTree as etree
except ImportError:
	try:
		import xml.etree.cElementTree as etree
	except ImportError:
		exit_err("Failed to import cElementTree from any known place")

TIMEOUT = 4
E_RETRY = 4    					# How Many times retry request when there is an error
BASE_PATH = "./data/kvb_data/" 	# Path to data folder
FILENAME = BASE_PATH + strftime("%Y-%m-%d") + ".csv"	# Create one file per day
HEADER = {'Accept-encoding' : 'gzip'} 					# Requesting data gzip compressed to reduce traffic
URL = "https://nextbike.net/maps/nextbike-live.xml?domains=kg"

##  Error log to mail
FROM = "mc51@gmail.com"			# Mail sender
TO = "mc51@gmail.com" 			# Mail receiver
SERVER = "smtp.gmail.com"  		# SMTP Server
MAIL_LOGIN = "mc51@gmail.com"
MAIL_PW = "Password123"
There are comments in the code so there is no need to get too detailed. With the requests module we retrieve our data. Parsing the data is done with ElementTree which is a light-weight solution for dealing with XML. To save disk-space we will compress the csv files we create as gzip files. Finally, with smptlib we send emails whenever a serious error occurs. The main part of the script simply calls the request function. If it encounters errors, it prints them and calls the sendMail function to inform us about that:
def main():
	if request(URL):
		print(strftime("\n\n%Y-%m-%d  %H:%M:%S "+ " finished successfully!\n\n"))
	else:
		msg = strftime("%Y-%m-%d  %H:%M:%S") + " there have been fatal error(s).\n"
		subj = "KVB Error"
		sendMail(subj, msg)
		sys.stderr.write(msg)

if __name__ == '__main__':
	main()
Now, have a look at how easy it is to retrieve the data:
def request(url, num=1):
	try:
		req = requests.get(URL, headers=HEADER, timeout=TIMEOUT)
	except Exception as e:
		sys.stderr.write(strftime("%Y-%m-%d %H:%M:%S") + " error while requesting:" + str(e) + "\n")
		if num < E_RETRY:
			time.sleep(2*num)
			request(url, num+1)
		else:
			return None
	else:
		data = req.content
		if to_csv(data):
			return True
		else:
			return None
Basically, there are two lines of code that do all the work. With req = requests.get(URL, headers=HEADER, timeout=TIMEOUT) we send an HTTP GET request for the XML file. Then data = req.content stores the answer which is the file’s content. If we get an error sending our request, we wait a few seconds and try again. After a few tries we give up and return None so that the main() function knows something went wrong. When the request goes through we call the to_csv function passing on the received data:
    def to_csv(xml_data):
        tree = etree.fromstring(xml_data)       # Parse XML Data
        try:
            with gzip.open(FILENAME+".gz", 'at') as target:     # compress to save diskspace - t for text-mode!
                w = csv.writer(target)
                for elem in tree.iter():
                    if "bike_numbers" in elem.attrib.keys():    # Get only data on bikes
                        elem.attrib = {k: v.encode("utf-8") for k,v in elem.attrib.items() } # encode to byte string before writing to file
                        w.writerow([strftime("%Y-%m-%d"), strftime("%H-%M-%S"), strftime("%a"),
                            elem.attrib["uid"], elem.attrib["bike_numbers"], elem.attrib["lat"],
                            elem.attrib["lng"], elem.attrib["name"]])
        except Exception as e:
            sys.stderr.write(strftime("%Y-%m-%d %H:%M:%S") + " error writing data: " + str(e) + "\n" )
            return None
        return True
There is quite a bit going on here, so I’ll be more wordy. The line tree = etree.fromstring(xml_data) parses the XML string directly into an Element Object. This is the root element, in our case <marker>. Then, we open the file where we will save our parsed data as a gzip file. We use at or append text mode. Using the gzip module is really convenient. We only have to change the usual with open(FILENAME,"a+") as target: to the line above. In result, we get a file that is 25 times smaller. Following, we use the csv module to create our writer w that writes our parsed data to disk. The for loop, loops through all child elements of the tree. For each element, we include only those that have the string “bike_numbers” as an attribute name. This excludes irrelevant data not containing information on bikes. Before we write each row to disk with w.writerow, we have to encode the data to a byte string. Dealing with strings in Python can be pretty annoying. Thus, you should understand the difference between unicode strings and byte strings. For a short intro read this and for a more detailed explanation this. Some attribute values in our data contain German umlauts like “Köln”. Consequently, encoding to UTF-8 is necessary when using Python 2.X which would otherwise try to use ASCII encoding. Unfortunately, ASCII doesn’t know about umlauts and fails. We encode all values by using a dictionary comprehension and replacing the original elem.attrib dictionary. Thereafter, we write the relevant data to disk and also add a date and time stamp. Finally, we catch any exception, print it and return None to indicate that we encountered a problem to the calling function. The only part left is the code for sending out e-mails if the script fails:
    # Send email over smtp
    def sendMail(SUBJECT,TEXT):
        message = 'Subject: %s\n\n%s' % (SUBJECT, TEXT)
        server = smtplib.SMTP(SERVER)
        server.starttls()
        server.login(MAIL_LOGIN, MAIL_PW)
        server.sendmail(FROM, TO, message)
        server.quit()
This makes use of the smptlib module and is self explaining. I incorporated it, so that I can let the script run as a regular (cron)job on a remote machine and still get immediate notice if something goes wrong. When regularly collecting data over long periods, it is crucial to react quickly when your script fails. Otherwise, your data quality will suffer because of missing periods. This can be very frustrating in the analysis.
I added the finished script to a cronjob and started building a dataset of bike location data in Cologne. This will give me a nice little time series to analyze. In the second part of the series we will start the basic analysis. The focus will be on creating visualizations of the location data on maps.